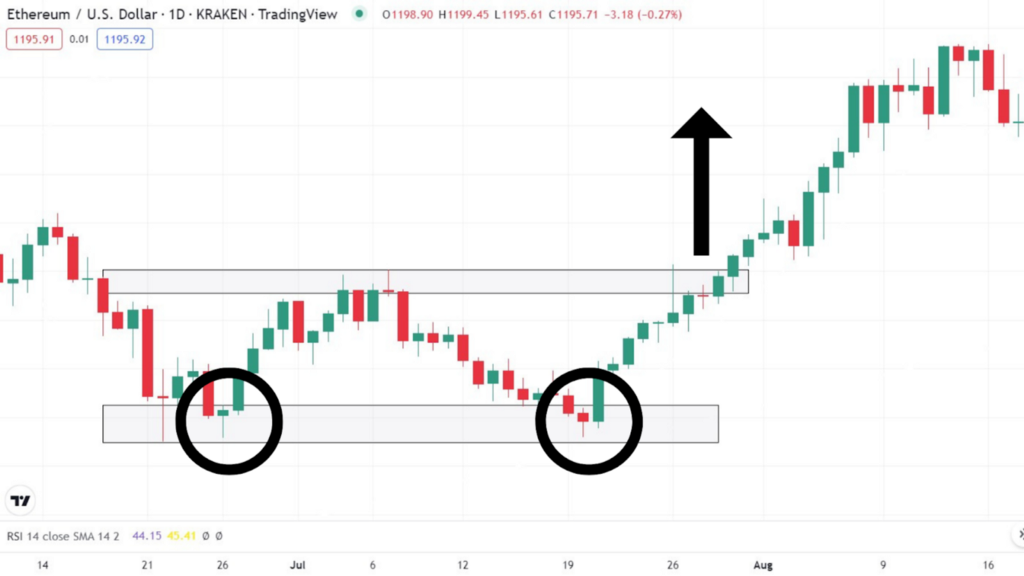
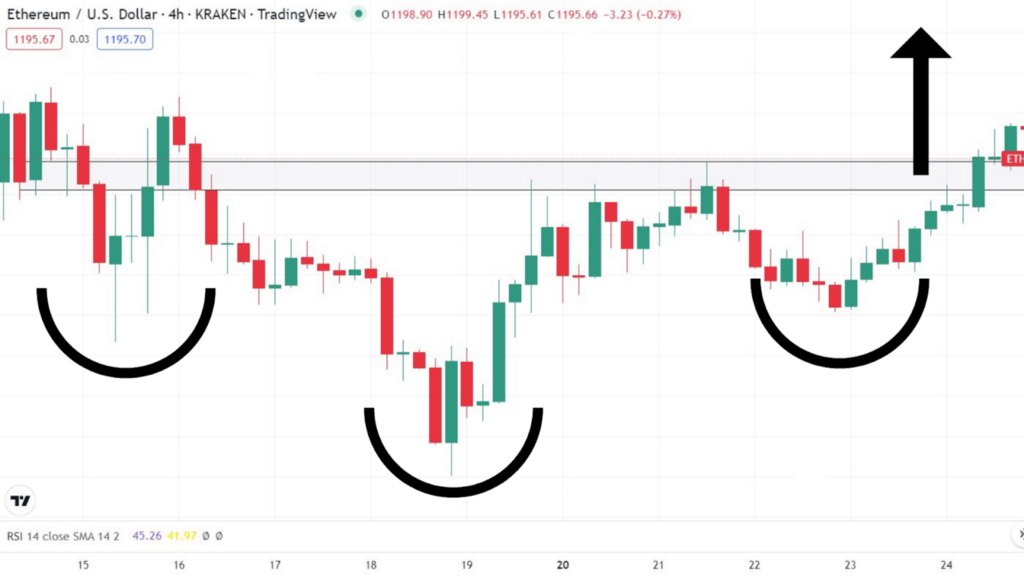
The Double Bottom
A double bottom pattern occurs when there are two bounces off of the same level of support, as shown below. This pattern typically occurs after a bearish period and signals a reversal in favour of the bulls. This pattern is viewed so bullishly because two bounces off the same level confirm that level as support, meaning the price can increase. The big move associated with this pattern comes after breaking the “neckline”, shown by the top rectangle zone.
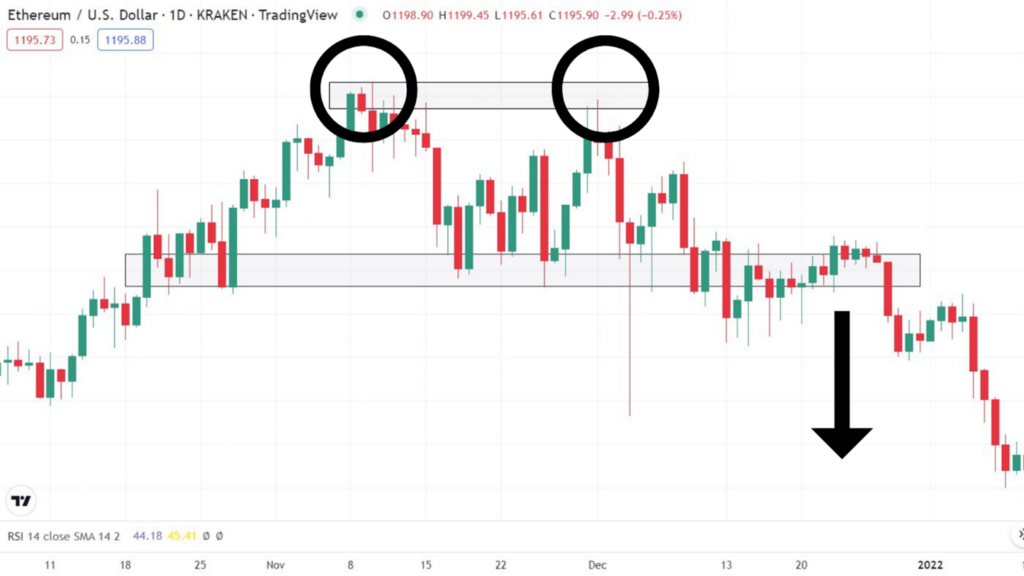
The Double Top
A double-top pattern is the opposite of the previously mentioned pattern. It is marked by two rejections off of the same resistance area. This pattern is a bearish reversal pattern, meaning that the price enters this pattern bullish and leaves this pattern bearish. One reason this pattern occurs is that often at resistance levels, traders will buy in with hopes of a breakout to further levels. When this breakout fails to appear, and the price falls, their trade is now in a loss. When the price returns to this same level, traders will often cut their losses and sell in the area where they opened the trade, again pushing the price further down. Typically this pattern is confirmed after seeing the two rejections and then a neckline break.
Head and Shoulders Pattern
The head and shoulders pattern is an infamous trading pattern named after its similarities with a person’s silhouette. This is a bearish reversal pattern that signifies bearish price action in the near term. It is identified by two lower peaks (the shoulders) and one higher central peak (the head). Much like the double bottom and double top, the pattern is confirmed by the break of the neckline.
Inverse Head and Shoulders Pattern
The inverse head and shoulders pattern is the reverse of the head and shoulders pattern. It is a bullish reversal pattern; if it plays out, the trend changes from bearish to bullish. Like the head and shoulder pattern, it is also identified by two shoulders and a head. However, these are flipped, with the heads and shoulders seeming more like two dips with a more significant drop in the middle.
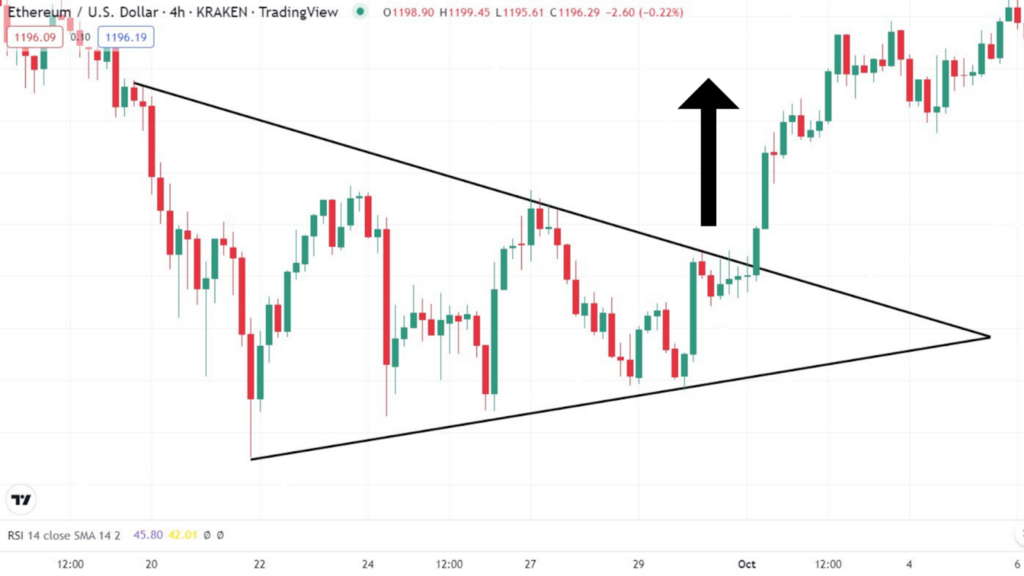
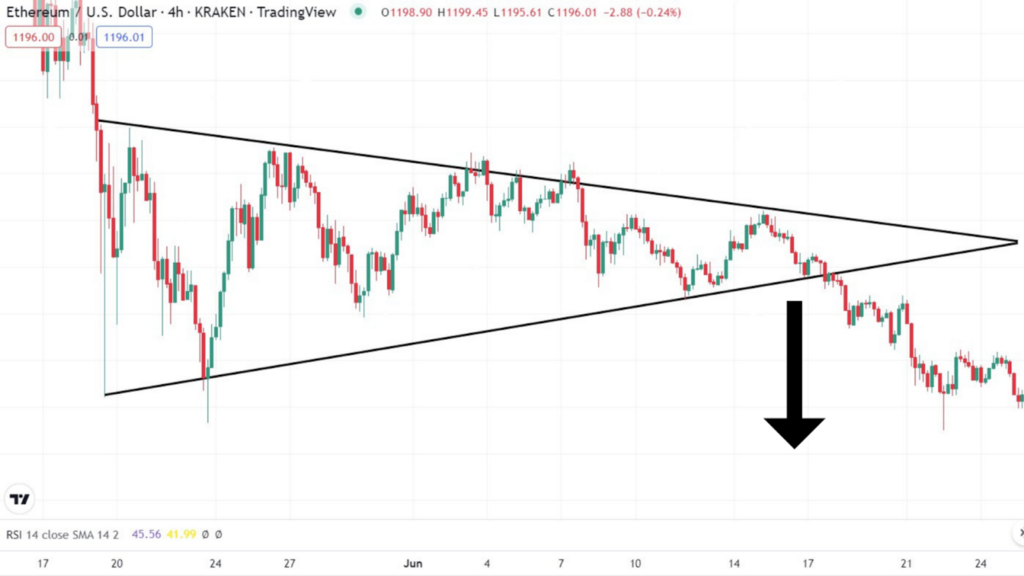
Triangle Patterns
Triangle Patterns are pervasive in crypto. Many variations, such as wedges and microphone patterns and more, could be placed into this category, but for the sake of simplicity, we will only cover the basics.
Common attributes of all triangle patterns are: two intersecting trendlines forming a triangle, one acting as support and one acting as resistance. There then is a tightening or compression of price as the triangle pattern plays out until the support trend line breaks (and price breaks down) or the resistance trend line breaks (and price breaks out). This occurs because, like a spring, price tends to get pent up and then explodes in whichever direction breaks.
Triangle Breakout
Triangle Breakdown
In Summary
The trading patterns in this article occur in almost every time frame and as a trader learning their structure is very worthwhile. This is because the better you get at spotting them, the more likely you can catch them forming in real-time and plan your trades accordingly. Although there are other patterns not mentioned in this article such as the cup and handle, microphone pattern, channels, and more, the patterns listed are great first tools in your traders’ toolbox to use to gain insights on the markets.
(by Liam McWilliams)

All Comments